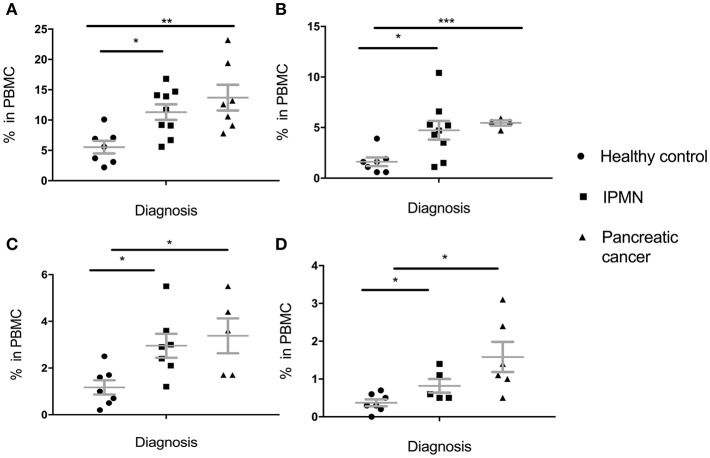
Figure 2.
Levels of circulating total MDSC and various MDSC subpopulations in PBMC of individuals diagnosed with premalignant pancreatic intraductal papillary mucinous neoplasms (IPMN) compared to healthy individuals and individuals with pancreatic cancer. (A) Total MDSC; (B) PMN-MDSC; (C) M-MDSC; (D) E-MDSC. Each symbol represent a single individual. Mean with SEM bar for each group is shown in grey. *p < 0.05, **p < 0.01,***p < 0.001.

