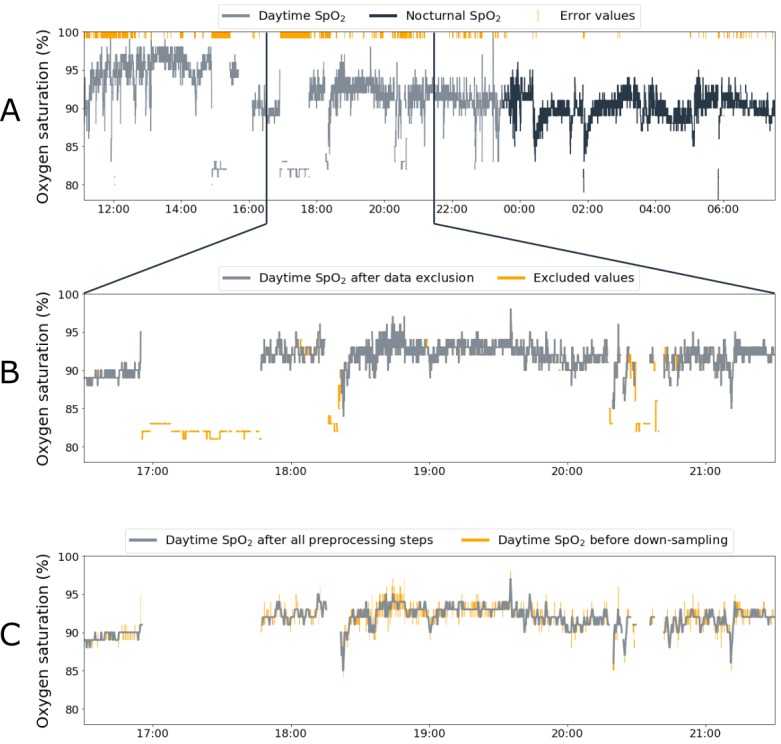
Figure 2.

Visualization of the different preprocessing steps. Panel A shows all original data, containing error values, that are divided into daytime and nocturnal data. Panel B zooms in on the effect of data exclusion on a specific part of daytime peripheral blood oxygen saturation (SpO2) data. Panel C zooms in on the effect of down-sampling and interpolating on the same part of daytime SpO2 data.
