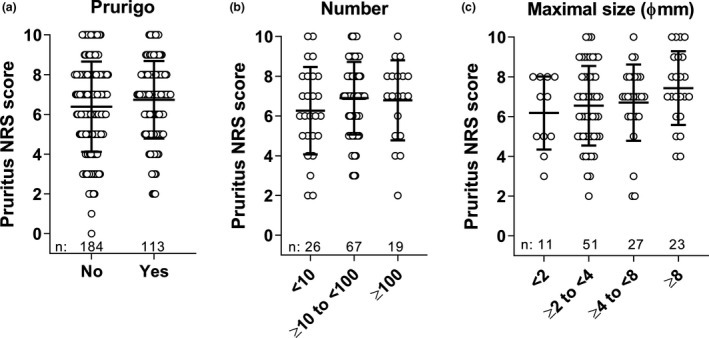
Figure 2.

Association of prurigo and pruritus NRS. (a) Pruritus NRS scores plotted for patients with and without prurigo nodules at baseline. (b) Pruritus NRS scores plotted for patients with prurigo nodules by number category and (c) by maximal size category. Number of patients in each category are shown as n. Bars depict mean ± standard deviation. NRS, numerical rating scale.
