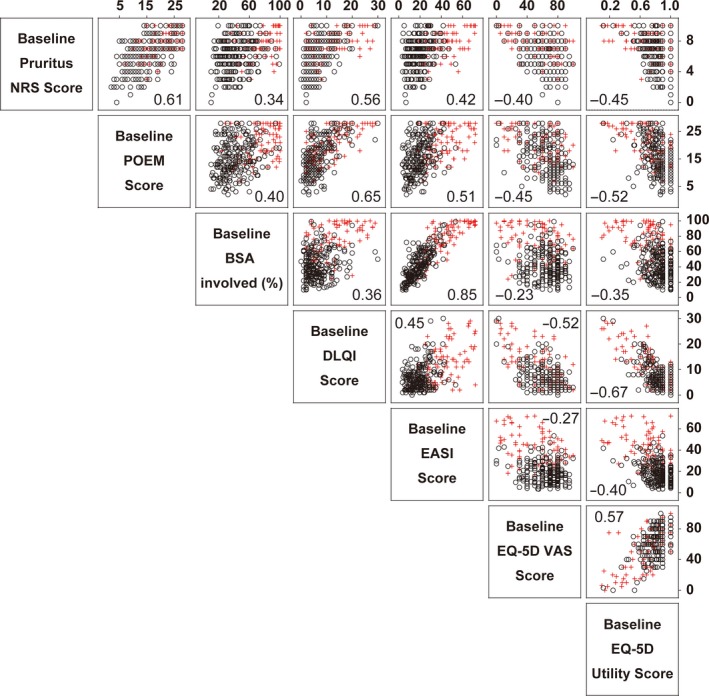
Figure 4.

Relationship between various disease measures and disease severity. Correlations between disease severity measures are shown in a matrix. The values in the graphs are Spearman's rank correlation coefficient (r). Black and red symbols depict the patients with an IGA of 3 and 4, respectively. BSA, body surface area; DLQI, Dermatology Life Quality Index; EASI, Eczema Area and Severity Index; EQ‐5D, EuroQOL group health questionnaire with five dimensions; IGA, Investigator's Global Assessment; NRS, numerical rating scale; POEM, Patient‐Oriented Eczema Measure; VAS, visual analog scale.
