
Figure 2.
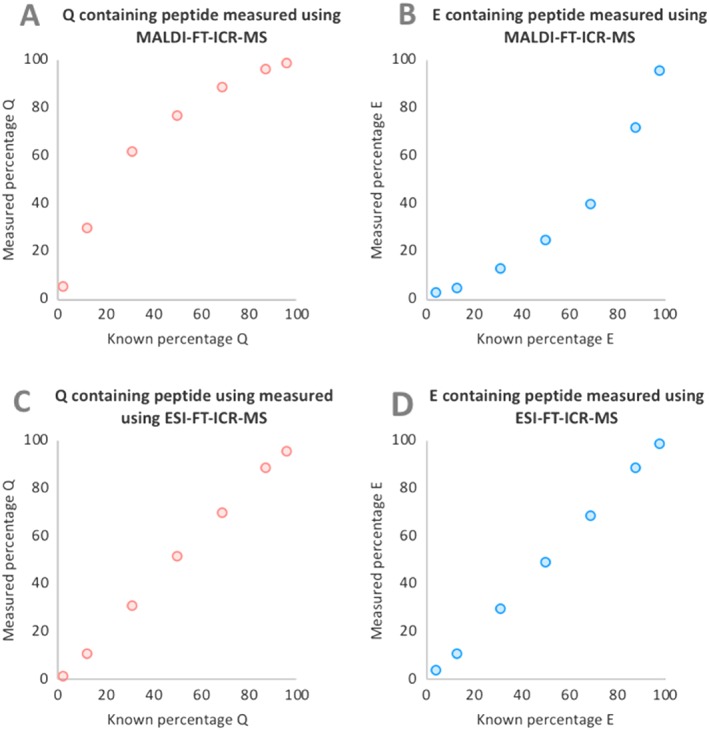
Plots showing measured percentage of product peptides Q and E, determined using MALDI (A and B) and ESI (C and D), against the known percentage. When using MALDI there is an underestimation of product peptide E [Color figure can be viewed at wileyonlinelibrary.com]