
Figure 3.
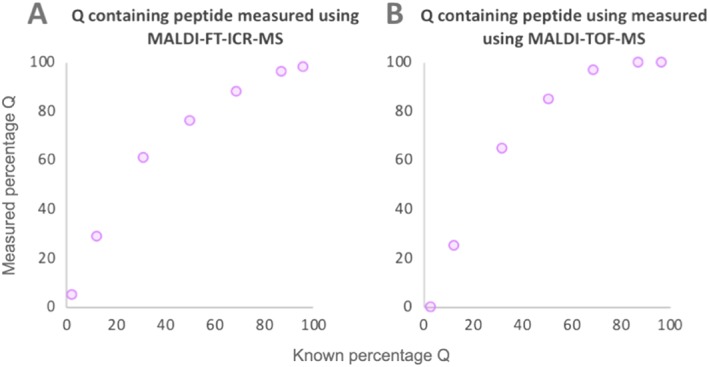
Ratios of Q‐ and E‐containing peptides, obtained using MALDI‐TOF‐MS (B). Due to an overestimation of the Q‐containing peptide a curvilinear relationship is observed. The same samples were analysed using a higher resolution FT‐ICR mass spectrometer (A), with the data showing a similar relationship [Color figure can be viewed at wileyonlinelibrary.com]