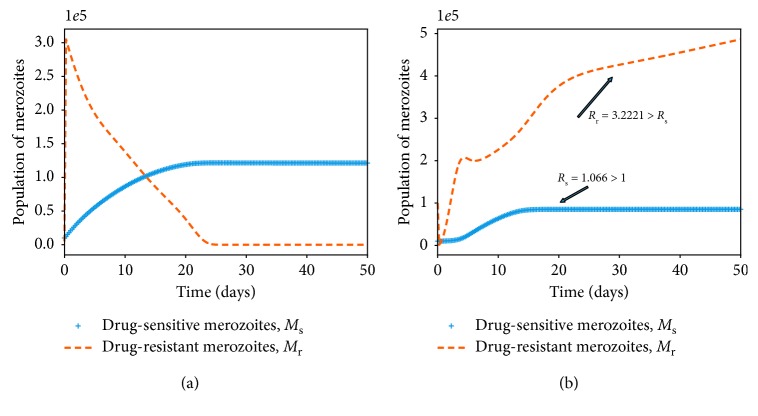
Figure 5.
Simulations of model system (11)–(18). The figures show the dynamics of the merozoites under different conditions of the threshold values R s and R r. Competitive exclusion among the parasite strains is shown in (a). In (b), both parasite strains coexists and R r > R s, Ψ1=0. Other parameter values are available in Table 3.

