
Figure 4.
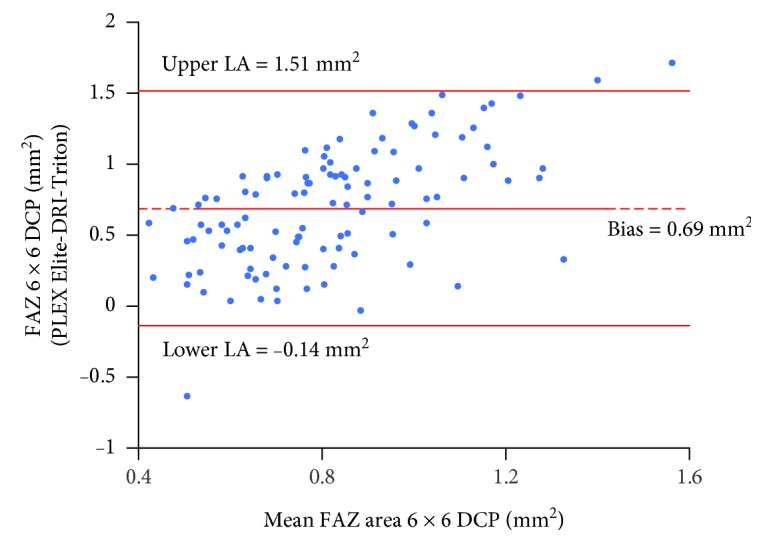
Bland-Altman plot for the FAZ area in 6 × 6 mm angiocube scans evaluated at the DCP measured with PLEX Elite and DRI-Triton. The central line indicates the mean of the differences or bias; the upper and lower lines indicate the upper and lower limits of agreement (LA), respectively. DCP: deep capillary plexus.