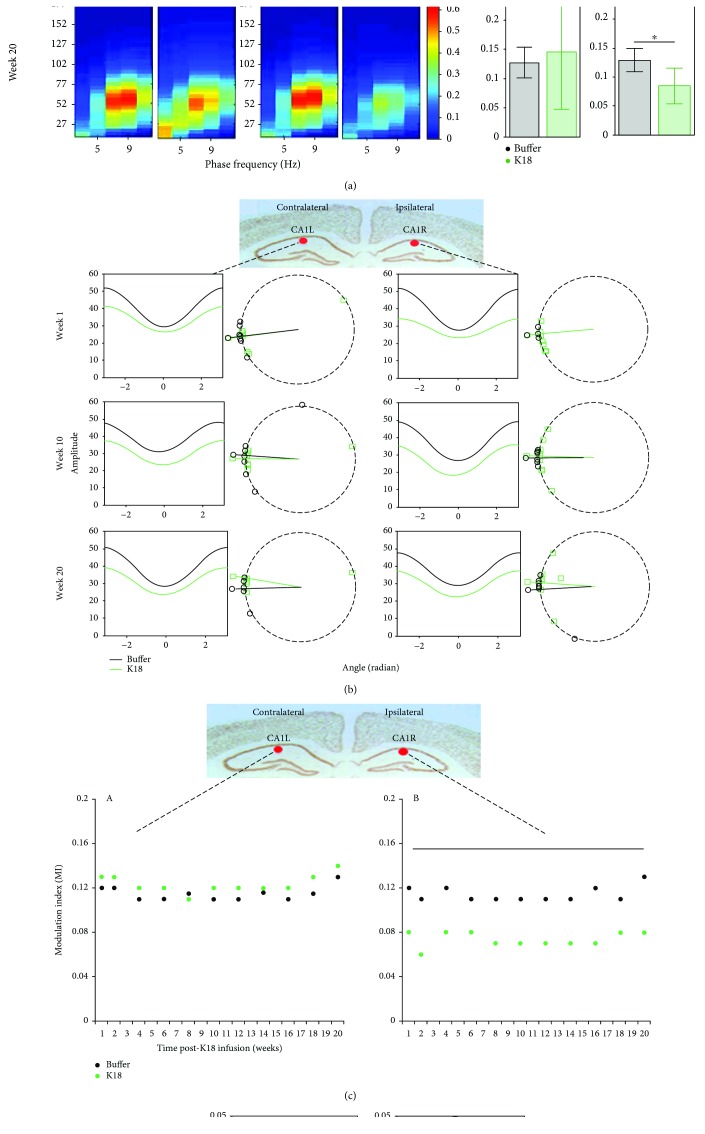
Figure 2.
(a) Heat maps showing the mean phase-amplitude coupling (PAC) modulation index at the CA1L and CA1R electrodes for buffer- (black, n = 7) and K18- (green, n = 8) injected mice, at recording weeks 1, 10, and 20. As shown by the color scale, “hotter” colors indicate high coupling values while “colder” colors indicate low or no coupling. Bar graphs showing the mean (across animals) theta-gamma PAC (with 95% CI) at the CA1L and CA1R electrodes for buffer- (black, n = 7) and K18- (green, n = 8) injected mice, at recording weeks 1, 10, and 20. These means along animals' PAC values are calculated as the average PAC for the window of phase frequency: 3.5–12.5 Hz, and amplitude frequency: 32–100 Hz, to focus on theta-gamma PAC. Horizontal lines above the bar plots with asterisks indicate the presence of significant difference between buffer- and K18-injected animals (two-sample t-test; ∗p value < 0.05 and ∗∗p value < 0.01). (b) Averaged across animals' variations in gamma amplitude (vertical axes) as a function of theta phases (horizontal axes) obtained from the electrodes implanted in CA1L and CA1R for the weeks 1, 10, and 20 postadministration of the buffer and K18. Right plots show estimated phase shifts in obtained oscillations for each animal (shown as dots) and condition (buffer (black) and K18 (green) injected). Radii show circular mean values for buffer- and K18-injected groups of animals. No significant difference in means between groups across all time points was found with the Watson-Williams test. (c) Scatter graphs show mean theta-gamma PAC at the contralateral (CA1L) and ipsilateral (CA1R) CA1 regions of the K18 injection site, for all recording weeks, demonstrating changes in PAC over time, for the buffer-injected (black) and K18-injected (green) groups. Time intervals with significant differences (p < 0.05, two-sample t-test) between buffer-injected and K18-injected animals are shown by a horizontal line. (d) Bar charts quantifying the mean PAC in frontal electrodes for buffer- (black) and K18- (green) injected animals. Note that no significant difference (two-sample t-test) was observed between the study groups. Data are presented as mean values (with 95% CI).

