Figure 4.
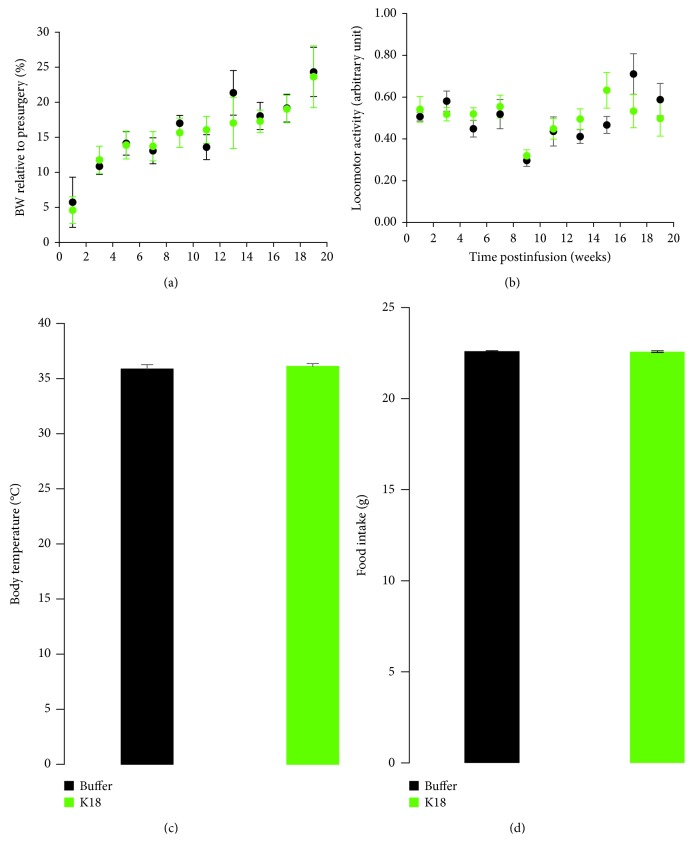
Mean locomotor activity, body weight, body temperature, and food intake in buffer- (black, n = 7) and K18- (green, n = 8) injected mice. (a) Body weight relative to presurgery and (b) locomotor activity were monitored daily prior and during EEG recording sessions, respectively. (c) Body temperature was measured in the middle of the study, and (d) food intake was measured daily during the first week postinfusion of K18 and buffer in the LC area. No changes in the mean activity levels, body weight, body temperature, and food intake were observed between the study groups. Data are expressed as mean ± sem.

