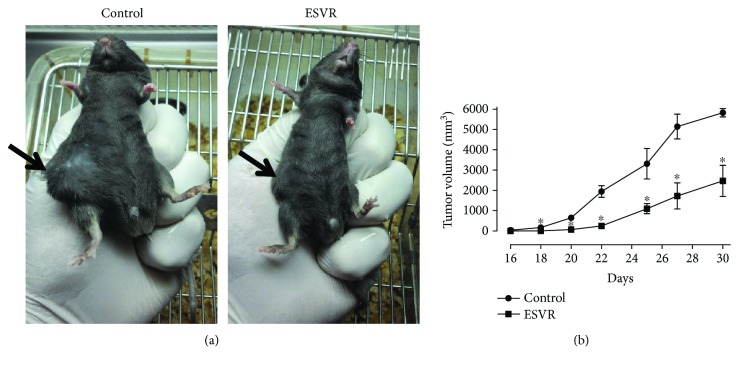
Figure 10.
The effect of ESVR on the tumor volume of B16F10-Nex2 cells induced in C57Bl-6 mice. Representative images of 30-day tumors (arrows) in (a) control animals treated with RPMI 1640 medium and animals treated with ESVR. (b) A representative plot of tumor volume progression during 30 days of treatment. The data are expressed as the means ± SEM (n = 7). ∗ p < 0.05 compared with the control group.

