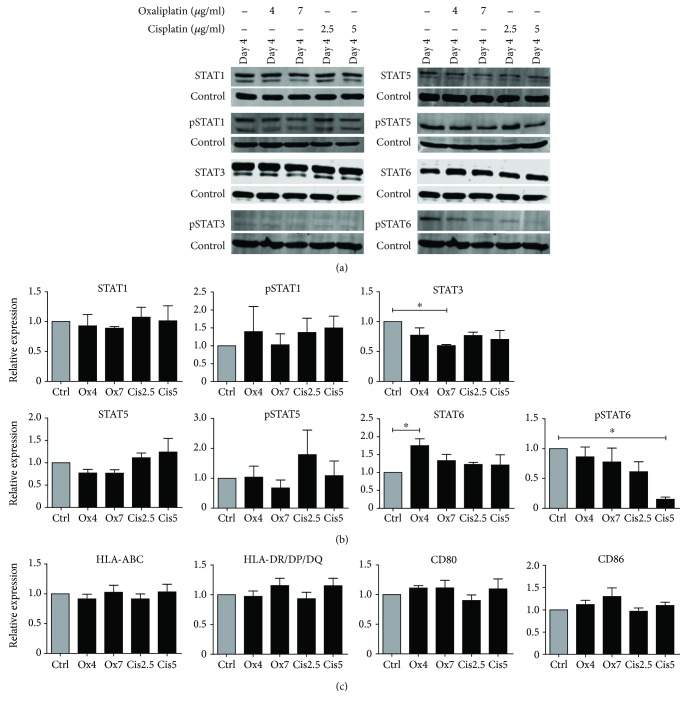
Figure 3.
Expression and phosphorylation of STAT proteins and phenotype of moDCs during differentiation in the presence or absence of platinum drugs. (a) Expression and phosphorylation of STAT1, STAT3, STAT5, and STAT6 on day 4 of differentiation in the presence or absence of oxaliplatin (4 μg/ml or 7 μg/ml) or cisplatin (2.5 μg/ml or 5 μg/ml), with tubulin used as loading control. One representative band of 3 donors is shown. (b) Quantification of STAT expression and phosphorylation, normalized to tubulin, shown as relative expression to untreated control cells (n = 3). Data are depicted as mean + SEM. (c) Expression of HLA-ABC and HLA-DR/DQ/DQ and costimulatory molecules CD80 and CD86 by moDCs treated with oxaliplatin (4 μg/ml or 7 μg/ml) or cisplatin (2.5 μg/ml or 5 μg/ml) during differentiation as compared to untreated moDCs. The mean fluorescence intensities (MFIs) of live cells are shown as mean fold of untreated control cells + SEM (n = 4). ∗ P < 0.05.

