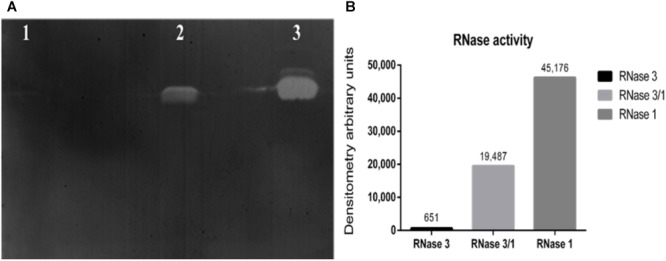
FIGURE 2.

Catalytic characterization of RNase3/1 by zymogram. (A) Activity staining gel showing the degradation of poly(U) with 20 ng of each protein. RNase 3 (lane 1), RNase 3/1 (lane 2), and RNase 1 (lane 3). (B) Densitometric analysis of the bands of the activity staining gel. Quantification was done from a scan image using Quantity One software (Bio-Rad®).
