
FIGURE 5.
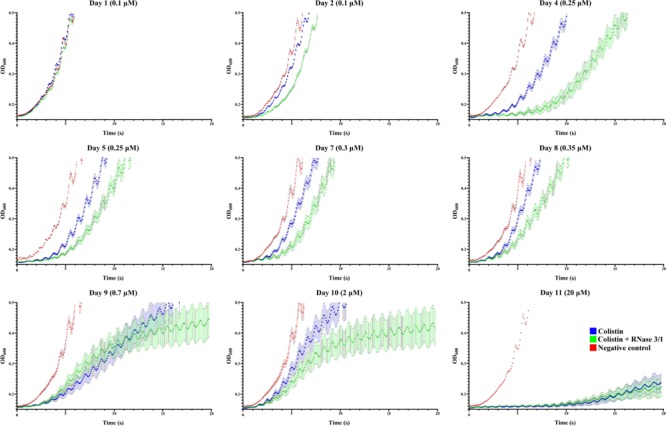
A. baumannii growth curves at representative days of exposure. Bacterial culture growth was monitored following 1/150 dilution by OD600 reading. Points represent the mean of all the lineages for each day and condition. In red is shown the negative control, in blue the colistin-exposed cultures and in green, the colistin + RNase 3/1 conditions. Error bars represent the standard error of the mean. A statistical analysis was applied to further evaluate the significance of the observed differences between the behavior of the cultures exposed only to colistin and the cultures exposed to both colistin and RNase 3/1. Taking as a reference the time needed for the bacteria to reach the exponential phase (OD600 = 0.4), we performed a comparison between cultures belonging to the same cycle (Figure 6B) and cultures of consecutive cycles within each condition (Supplementary Figures S4, S5).