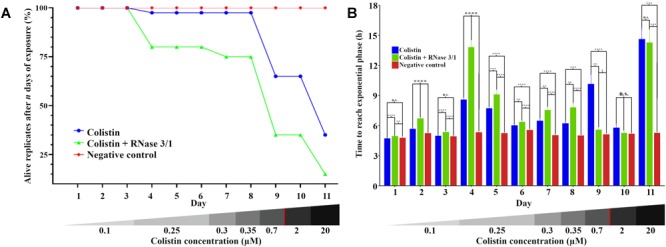
FIGURE 6.

Evolution of the resistance acquisition of A. baumannii to colistin in the presence and absence of RNase 3/1. (A) Graphical representation of the surviving replicates after each day of exposure. (B) Graphical representation of the time needed for the surviving bacteria upon treatment to reach exponential phase (OD600 = 0.4). The remaining alive replicates are indicated following each day of exposure. Significance is calculated between the different conditions of the same day; n.s. means no significance between the compared samples, ∗p < 0.05, ∗∗p < 0.01, ∗∗∗p < 0.001, and ∗∗∗∗p < 0.0001 are indicated. The bottom red line indicates the calculated MIC of the colistin alone.
