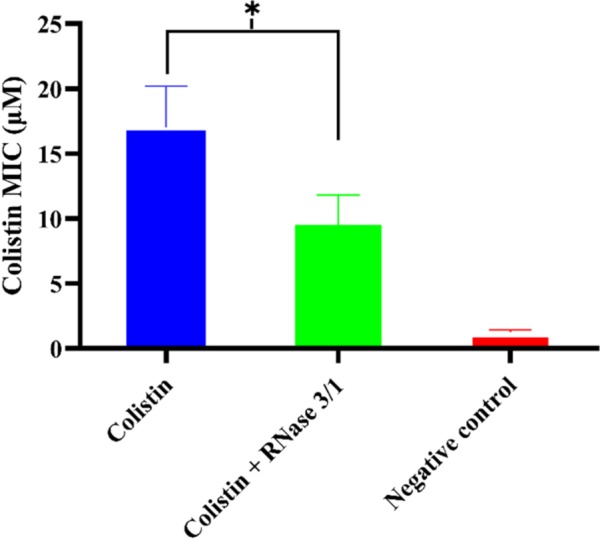
FIGURE 7.

Comparison of the calculated average mean MIC value following Assay 1 treatment for RNase 3/1-supplemented versus non-supplemented bacterial strains exposed to colistin. Error bars show the standard error of the mean. ∗indicates that the p-value is < 0.05.
