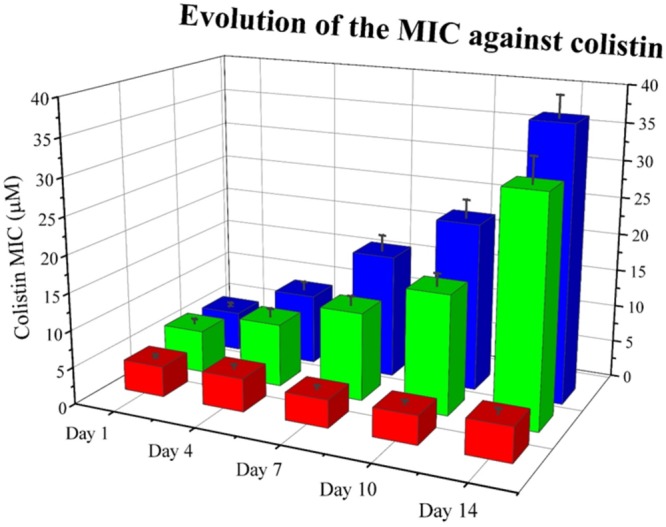
FIGURE 8.

Evolution of the mean MIC value for colistin of each assayed condition in Assay 2. Overall reduction of calculated MIC for colistin is observed for samples supplemented with RNase 3/1. Red corresponds to the negative control, blue to the colistin alone condition and green to the colistin + RNase 3/1 condition. Data from selected days is shown. The raw data used to produce the figure is shown in Supplementary Figure S6. Error bars show the standard error of the mean.
