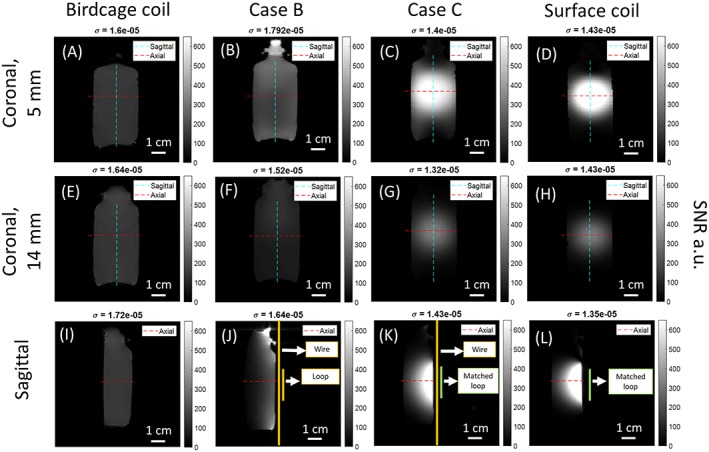
Figure 4.

Coronal slices at depths of 5 mm and 14 mm from the edge of the phantom close to the coils and sagittal SNR maps in gray scale (dashed lines locate the profile cuts). (A), (E), (I): Birdcage coil; (B), (F), (J): Case B; (C), (G), (K): Case C; (D), (H), (L): Surface coil. In the coronal slices, the cyan line gives the coronal‐sagittal profiles; the red line gives the coronal‐axial profiles. In the sagittal slices, the red line gives the axial‐coronal profiles. Noise standard deviation is given at the top of each map
