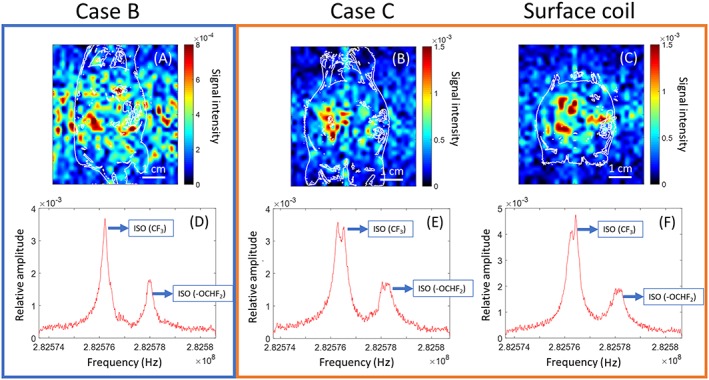
Figure 8.

Top: In vivo 19F FLASH coronal‐plane images in jet scale obtained with: (A) case B; (B) case C; and (C) surface coil. Because of the different sensitivities, the color scale is modified between map (A), and maps (B) and (C). The images were overlaid with 1H FLASH contour plot (white lines) to illustrate the anatomical location of 19F nuclei. Bottom: In vivo 19F spectra for each case. The two peaks which are labeled correspond to two fluorinated groups of the isoflurane molecule
