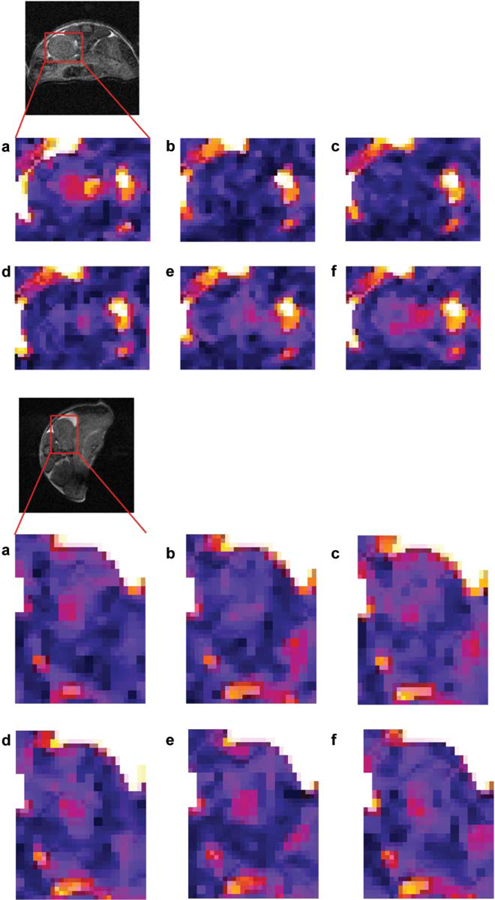
Fig. 11.

Typical WALTZ-SE images of the kidney zoomed in on the areas marked on the anatomical images. Images were taken just before or after 20 mM (top) or 2 mM (bottom) bolus injection of Tm-DOTAM-Gly (reproduced from Magn Reson Med 2007 with permission). (a) Before injection, and (b-f) after injection: (b) 2 min 40 s, (c) 5 min 20 s, (d) 10 min 40 s, (e) 16 min, (f) 18 min 40 s. All timings refer to the beginning of injection and beginning of image acquisition. It appears that maximum intensity is observed around 3 min (b). As the agent clears through the kidney, the intensity gradually returns to the preinjection level (d-f).
