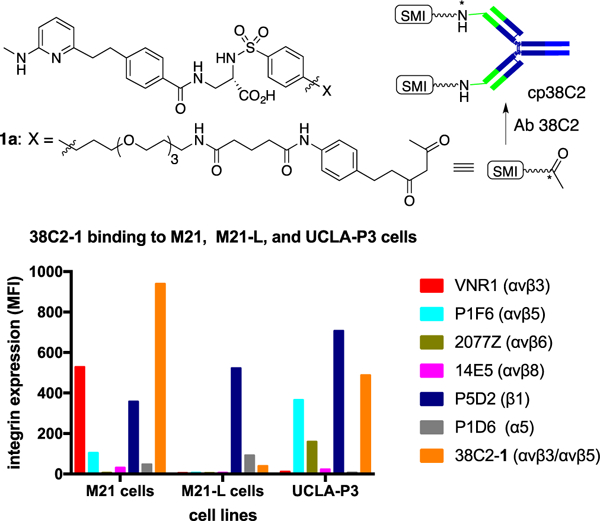
Figure 3.

Flow cytometry analysis showing (a) the αvβ3/αvβ5 integrin expression level in M21 cells, and (b) binding of cpAb 38C2-1, prepared by chemical programming of aldolase Ab 38C2 using a diketone derivative, 1a, of a potent αvβ3/αvβ5 integrin SMI, 1, to M21 and UCLA-P3 tumor cells expressing the target integrins. APC labeled anti-mouse polyclonal Ab (at a 1:100 dilution, i.e., 10 μg/mL in FACS buffer) was used to detect the binding of the control Abs (10 μg/mL) and cpAb 38C2–1 (20 μg/mL) to cells. The y-axis gives the relative mean fluorescence intensity in linear scale, and the x-axis describes cell line name. Key: Abs used to detect integrin expression on M21, M21-L, and UCLA-P3 cells were: VNR1 (for αvβ3), P1F6 (αvβ5), 2077Z (αvβ6), 14E5 (αvβ8), P5D2 (β1), and P1D6 (α5).
