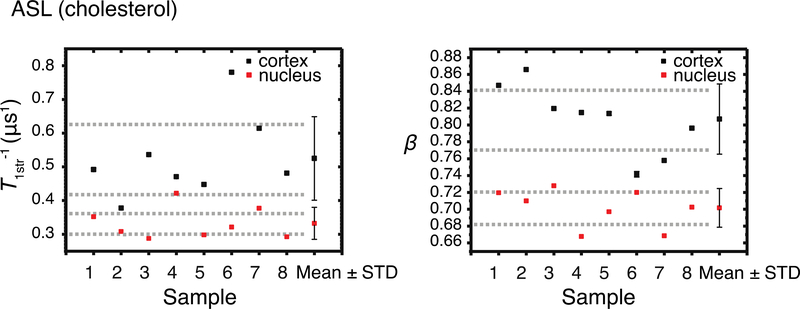
Figure 4.
Cumulative data for stretched-exponential relaxation rates (T1str−1), and corresponding beta parameters (β) SL ( hol analog) in samples of intact cortical and nuclear fiber cell membrane obtained separately from eight porcine eye lenses (see Eq. 3). Mean values (Mean) and standard deviations (STD) obtained for each group are indicated. Dashed lines indicate the interval around the mean values that represents the 95% confidence level.

