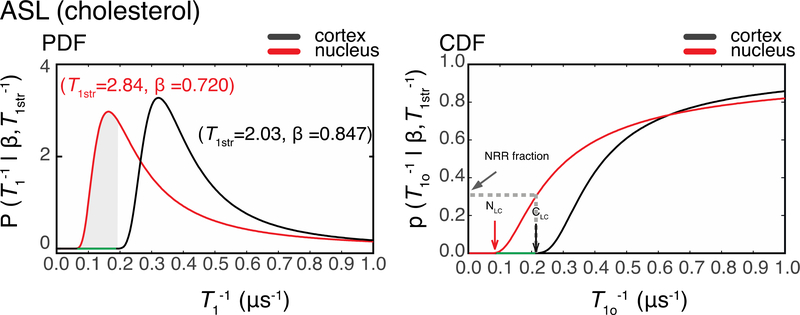
Figure 7.
PDF – probability distribution functions and CDF-cumulative distribution functions for the nuclear and cortical membranes of the same eye (Sample 1) labeled with ASL probes. The red lines are generated using the nuclear membrane parameters T1str = 2.84μs and β = 0.720 and the black lines are generated using the cortical membrane parameters T1str = 2.03 μs and β = 0.847. CDFs are the integrals of PDFs. NLC refers to the nuclear low-cutoff T1−1 value, and CLC refers to cortical low-cutoff T1−1 value. The p(T1o−1|T1str−1, β) at these point are equal to or less than 0.01%. The range of T1−1s between these points is the nuclear rigid range (NRR) highlighted in green on the PDF and CDF plots. The gray dashed line on the CDF plot and the grayed area on the PDF plot indicate the fractional intensity of the NRR in the nuclear membrane of the Sample 1 that was labeled with ASL. The same analysis was performed across all samples. The average NRR and the NRR fractional intensity are reported in the Results section.

