
Figure 2.
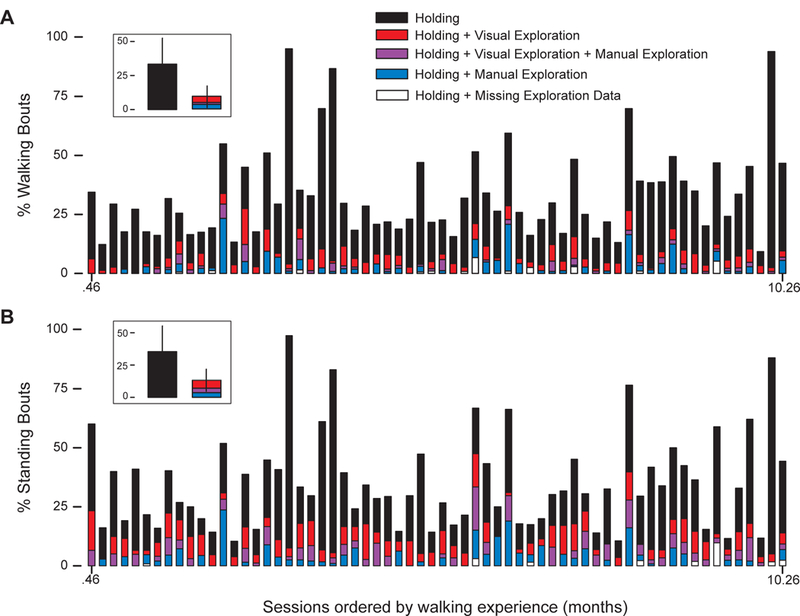
Frequency of holding and exploring objects while (A) walking and (B) standing across walking experience. Bars represent the percent of bouts in each session where the infant held (black bars), visually explored (red bars), manually explored (blue bars), or both visually and manually explored (purple bars) objects in hand while walking and standing. White bars denote bouts in which the infant’s hands or face were not available for coding exploration, but coders were still able to infer object carriage. Red, blue, purple, and white bars denote bouts when infants had objects in hand, so the total height of the bars show each infant’s overall rate of holding objects while walking or standing. Sessions are ordered by infant’s walking experience. Insets above each panel show the average percent of bouts in which infants held (black bars) and additionally explored (colored bars) objects.