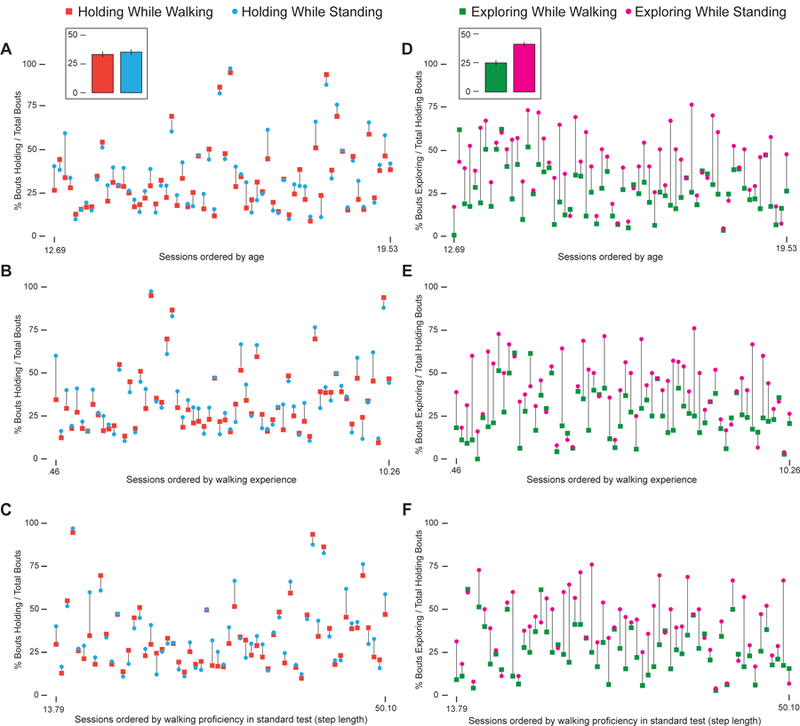
Figure 3.

Manual actions on objects while walking and standing across development. Left column shows holding as a percent of walking or standing bouts. Right column shows exploring as a percent of holding bouts while walking or standing. Each pair of symbols represents one session while walking (squares) and standing (circles). To view effects of holding and exploring across development, sessions are ordered in each graph by (A and D) age at test, (B and E) walking experience, and (C and F) walking proficiency based on step length in a standard straight-path assessment. Comparisons between the pattern of squares relative to circles show that holding did not differ between walking and standing, but exploration was more prevalent while standing than while walking. Insets at the top of each column show the overall effects of walking versus standing for holding (left column) and exploring (right column).
