
FIGURE 4.
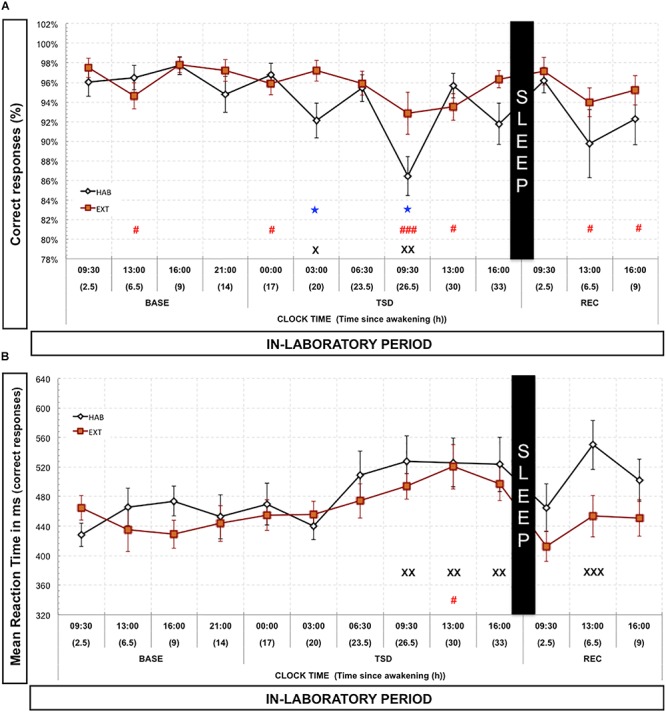
Percentage of correct responses (A) and mean reaction time (B) in the 0N-Back task (vigilance control condition). Percentage of correct responses (black and red lines) is represented as the mean (±SEM) for 14 subjects during baseline (BASE), total sleep deprivation (TSD), and recovery (REC) periods. X: Significantly different from 09:30 BASE value for the habitual (HAB) sleep condition (X for p < 0.05; XX for p < 0.01; and XXX for p < 0.001). # Significantly different from 9:30 BASE value for the extended (EXT) condition (# for p < 0.05; and ### for p < 0.001). ★ Significantly different between habitual (HAB) and extended (EXT) conditions (p < 0.05).