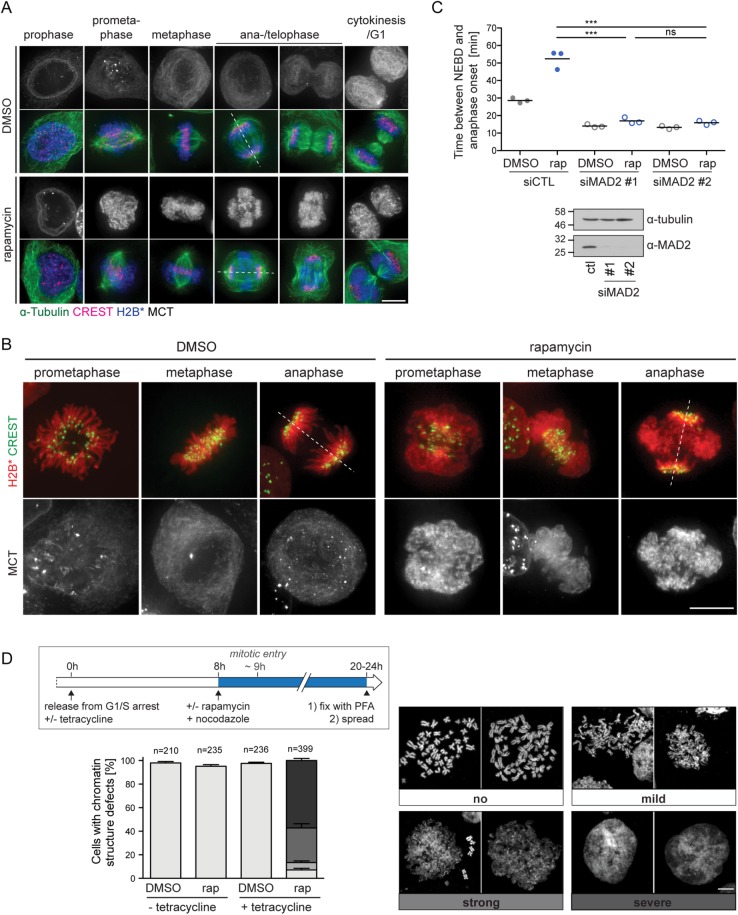
FIGURE 4:
Induced membrane-chromatin-contacts perturb the organization of mitotic chromatin. (A) Wide-field fluorescence microscopy of MCT/H2B* cells treated as in Figure 1B. Cells were stained for α-tubulin and kinetochores (CREST). Dashed lines represent spindle axes. (B) Representative wide-field fuorescent images of chromatin organization of DMSO- or rapamycin-treated MCT/H2B* cells progressing through mitosis. Kinetochores were immunostained using the CREST antibody. (C) Quantification of the time span between NEBD and anaphase onset of MCT/H2B* cells (as in Figure 1G) treated with either control or MAD2 siRNAs for 48 h. N = 3; mean ± SEM; n = 150 per condition. Bottom, immunoblot analysis of MAD2 depletion. (D) Analysis of MCT/H2B* cells with respect to mitotic chromatin structure. Flowchart of the cell synchronization protocol combined with drug treatment used for the generation of mitotic chromatin spreads (top). Representative confocal images of MeOH-fixed metaphase spreads from nocodazole-arrested MCT/H2B* cells. Spreads were counterstained with Hoechst. The chromosome structure defects were classified into four categories, ranging from a classical thread-like shape (“no”) to a disorganized amorphous cloud (“severe”). The quantification of each phenotype observed after the indicated treatment is shown in the bottom panel (N = 4; mean ± SEM; n, number of analyzed cells). Bars, 10 μm.

