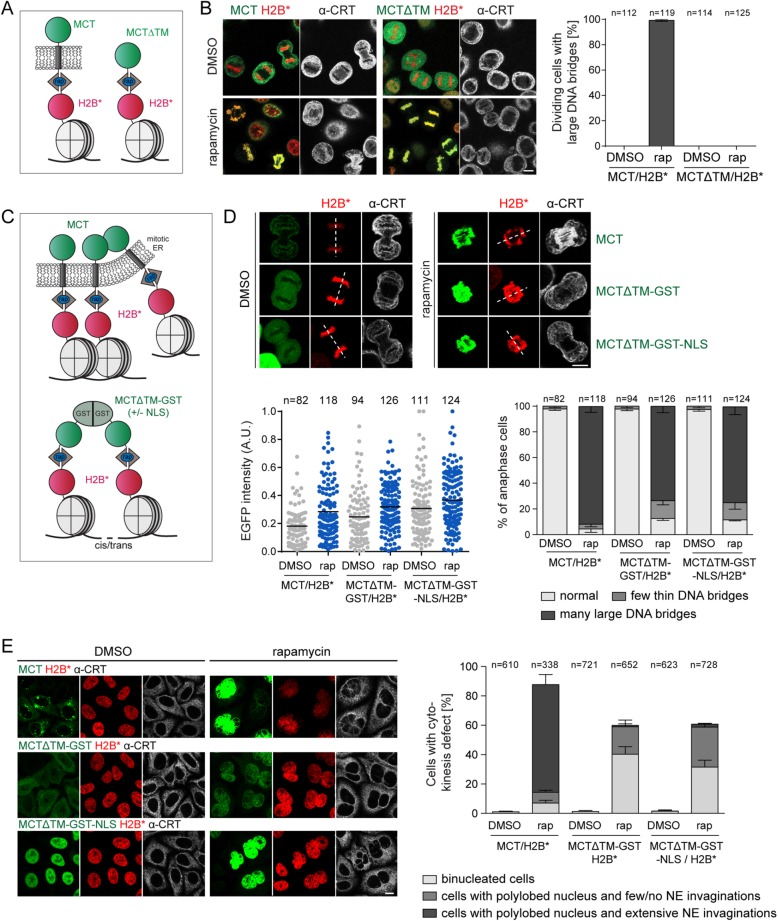
FIGURE 7:
Membrane-induced chromatin segregation defects can be mimicked by soluble, bivalent chromatin-binding proteins. (A) Schematic comparison of the MCT and a soluble derivative lacking the transmembrane domain (MCT∆TM). (B) Synchronized MCT/H2B* and MCT∆TM/H2B* cells were released into mitosis as in Figure 1B, fixed, stained for calreticulin, and analyzed by confocal microscopy. The number of dividing cells with large DNA bridges was quantified (N = 3; mean ± SEM; n, number of analyzed GFP-positive cells). (C) Depiction of chromatin cross-linking by the MCT and MCT∆TM-GST(-NLS). (D, E) MCT/H2B*, MCTΔTM-GST/H2B*, and MCTΔTM-GST-NLS/H2B* cells were synchronized, treated with DMSO or 200 nM rapamycin before mitotic entry, and fixed in anaphase or after mitosis. (D) Confocal images of MCT/H2B*, MCTΔTM-GST/H2B* or MCTΔTM-GST-NLS/H2B* anaphase cells. Relative GFP intensities of all analyzed cells (N = 3; mean ± SEM; n, total number of cells) and quantification of chromosome segregation defects. (E) Confocal images of MCT/H2B*, MCTΔTM-GST/H2B*, or MCTΔTM-GST-NLS/H2B* after mitosis. The indicated postmitotic aberrations were quantified (N = 3; mean ± SEM; n, number of cells). CRT: calreticulin; rap: rapamycin. Dashed lines represent spindle axes. Bars, 10 μm.

