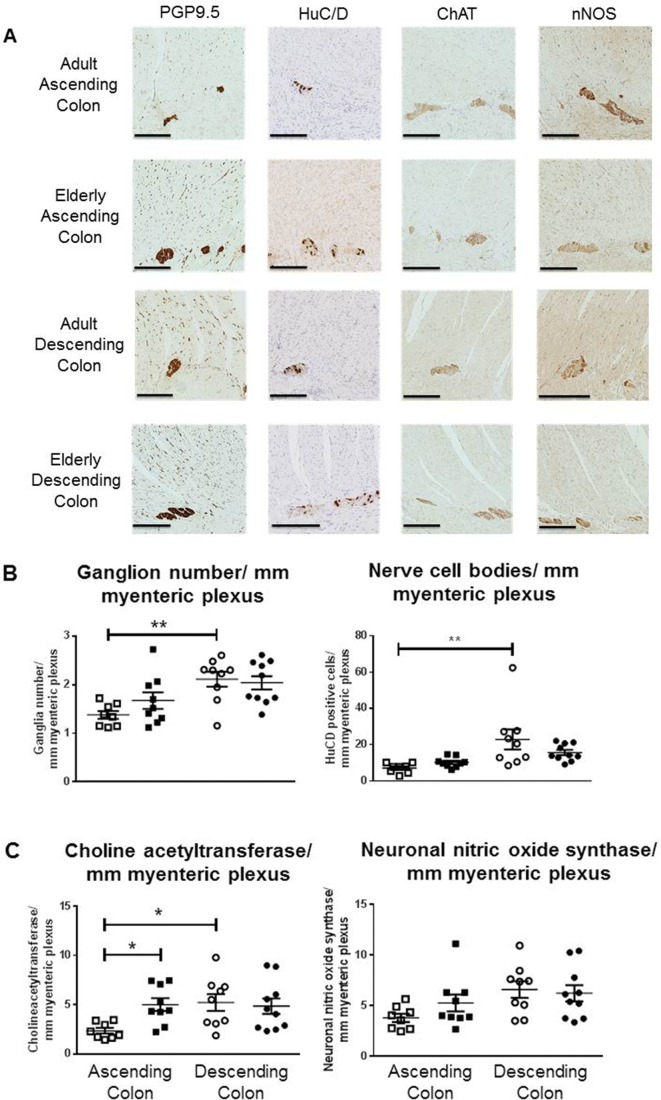
Figure 3.
Expression of myenteric neuronal markers in ascending and descending colon. Panel A shows representative staining examples from the adult (35–60 years of age) and elderly group (≥70 years) for each region of colon, using antibodies for human neuronal protein C/D (HuC/D), choline acetyltransferase (ChAT) and neuronal nitric oxide synthase (nNOS). Images were captured using NDP View version 2.3.1. Black scale bar is 250 µm. Counting was performed by two independent observers, and the values for each tissue are the mean of these counts. A ganglion was defined as a neural structure containing at least two neurons. The areas counted as neurons were between the circular and longitudinal muscle layers and represented areas of dark brown perikaryal staining in a cell that contained a nucleus (granular stain must cover the nucleus OR encircle at least 50% of circumference of the nucleus AND at least some cytoplasmic granular brown staining must be present). If the staining overlapped or appeared as a continuous area of dark brown staining, in the presence of two distinct nuclei and cell membranes, this was counted as two cell bodies; if there was ambiguity about the presence of a nucleus, the cell was not included. Panel B shows the number of ganglia and number of neuron cell bodies per millimetre of myenteric plexus (using the pan-neuronal cell body marker HuC/D) for adult (□) and elderly (■) ascending and descending (respectively o and •) colon. Panel C is arranged similarly and shows the numbers of neuron cell bodies per millimeter of myenteric plexus stained by the antibody for ChAT or nNOS. In Panels B and C, the data are expressed as means±SEM; n=8 adult ascending, 9 elderly ascending, 9 adult descending and 10 elderly descending colons for each stain. These were analysed using analysis of variance with Sidak’s multiple comparison tests; *P<0.05; **P<0.01, only where indicated. PGP9.5, protein gene product 9.5.

