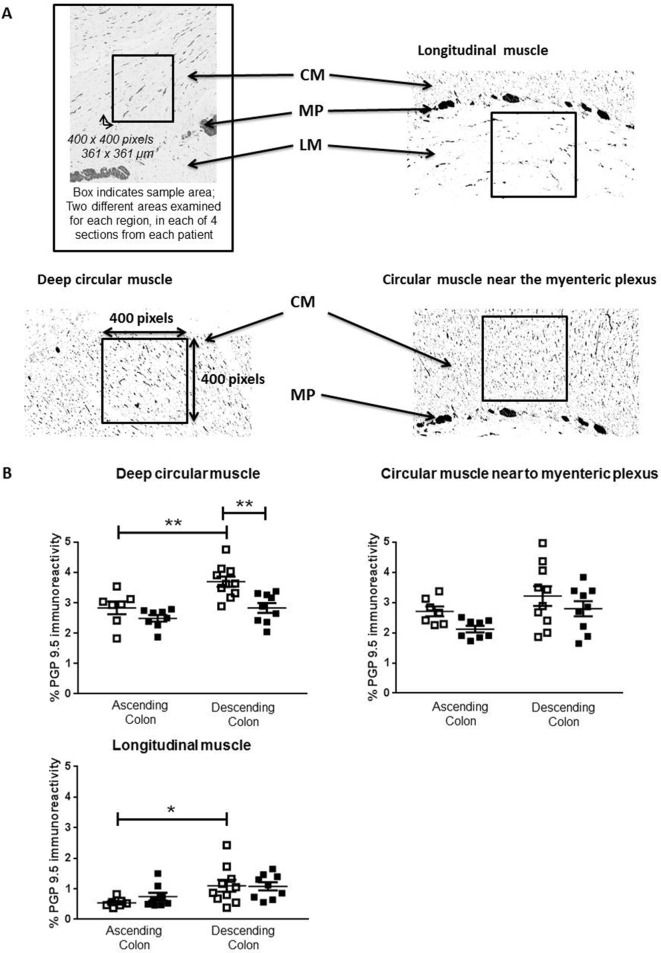
Figure 4.
Density of neuronal innervation within muscle layers. Panel A shows representative examples from protein gene product 9.5 (PGP9.5) stained paraffin-embedded sections of human colon muscle. Images were captured using NDP View version 2.3.1. Densiometric analysis was performed on filtered images converted to black and white, and the percentage density of staining measured over 400×400 pixel excerpts, as shown in the boxes, from the circular muscle (CM) near the myenteric plexus (MP), the deeper CM and the longitudinal muscle (LM), on a fixed magnification of 10×, using ImageJ. For each patient, four sections were analysed and for each region of muscle, two different fields were examined in each of the four sections by two separate assessors. Panel B shows the density of PGP9.5-positive nerve fibres in the adult (35–60 years of age; □) and elderly (≥70 years; ■) groups within ascending and descending colon, n=7 adult and n=8 elderly ascending colon and, respectively, 10 and 9 adult and elderly descending colon. Both assessors identified the same statistically significant changes or trends in the elderly (online supplementary data file 1). These data are expressed as means±SEM and were analysed using analysis of variance with Sidak’s multiple comparison test, *P<0.05; **P<0.01.

