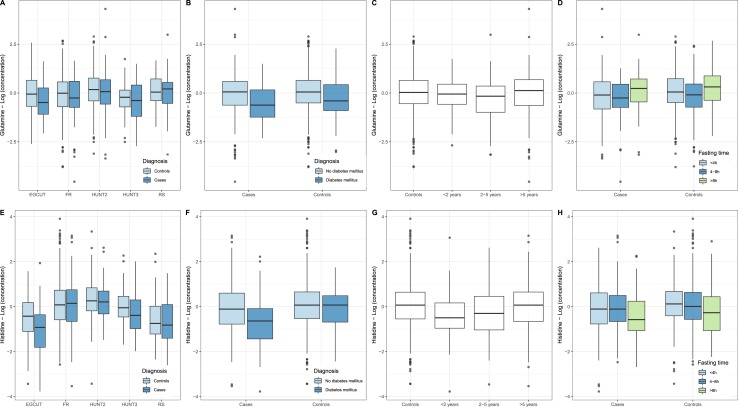
Figure 2.
Concentrations (logarithmic scale) of (A–D) glutamine and (E–H) histidine in the blood circulation in controls and cases, that is, those individuals who developed pancreatic cancer within a time window after blood sampling. (A and E) Distribution of the concentrations of controls (light blue) and cases (dark blue) in the different cohorts analyzed (EGCUT, FR, HUNT2, HUNT3, RS). (B and F) Distribution of concentrations in nondiabetics (light blue) and individuals diagnosed with T2DM (dark blue). (C and G) Distribution of concentrations in controls and cases sampled within 2 y before diagnosis, between 2 and 5 y before diagnosis, and >5 y before diagnosis. (D and H) Distribution of concentrations in nonfasting individuals (light blue), individuals who had a meal between 4 and 8 h before blood draw (dark blue), and fasting individuals (green, last meal was >8 h before blood draw). Box plots reflect the distribution of the concentrations in individual samples, including the middle quartiles (25th to 75th percentile of the data points are in the boxes); the horizontal band; the median value; the lower whiskers representing the data points up to 1.5 × the interquartile range (IQR) below the 25th percentile; the upper whiskers representing the data points up to 1.5 × IQR above the 75th percentile; the data points outside these ranges plotted as individual data points.

