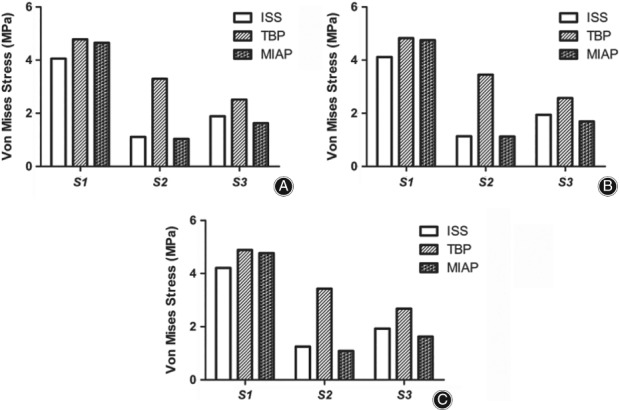
Figure 5.

Stress at the fracture interface in different motion states: in all three motion states, the maximum stress between the fracture interface of the TBP model was higher than that in the others, especially in the second vertebral fracture interface. (A) Under compression status. (B) Under bending status. (C) Under flexion status.
