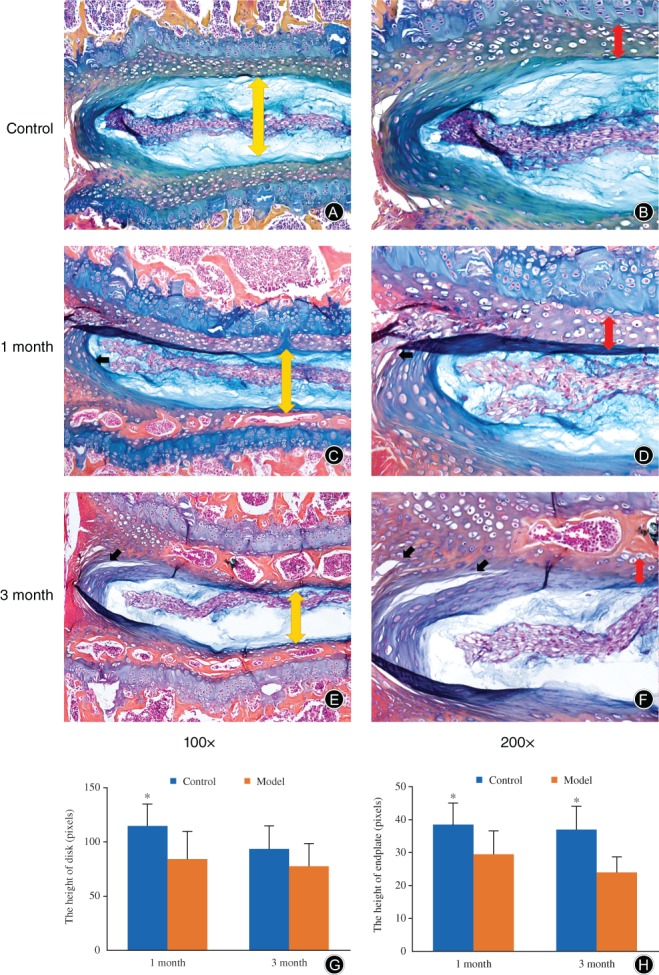
Figure 3.

Alcian blue/orange G staining of lumbar samples. In both of the model samples, the IVD structure became disorganized. In the model groups, the height of disks (yellow arrows) was significantly decreased at 1 month when compared with the control group (×100, A, C, G), while the height of the endplate (red arrows) was decreased at all time points when compared with the control samples (×200; B, D, H); fissures (black arrows) were found in the outer layer of the anulus fibrosus of the lumbar sample after modeling at both time points, but were larger at 3 months (E, F) compared to 1 month (B, D). The cartilage endplate was gradually replaced by ossification. The staining of the nucleus pulposus of the 3 month model group was thinner compared to that of the control group. More endplate ossification was developed in the 3‐month group (E, F).
