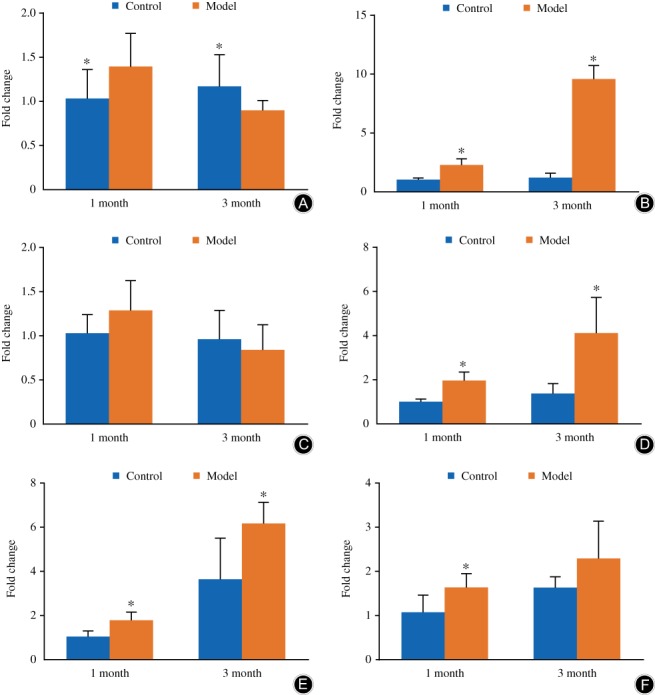
Figure 5.

The mRNA expression of ColIIa1, aggrecan, ColXa1, MMP‐13, ADAMTS‐5, and Runx2. In the model group, the mRNA expression of ColIIa1 and aggrecan decreased but not significantly (A, C), while that of ColXa1, MMP‐13, and ADAMTS‐5 were significantly upregulated (B, D, E), and that of Runx2 also had the trend of upregulating compared with the control group at the same time after modeling (F). The columns represent the mean ± standard deviation of six independent experiments.
