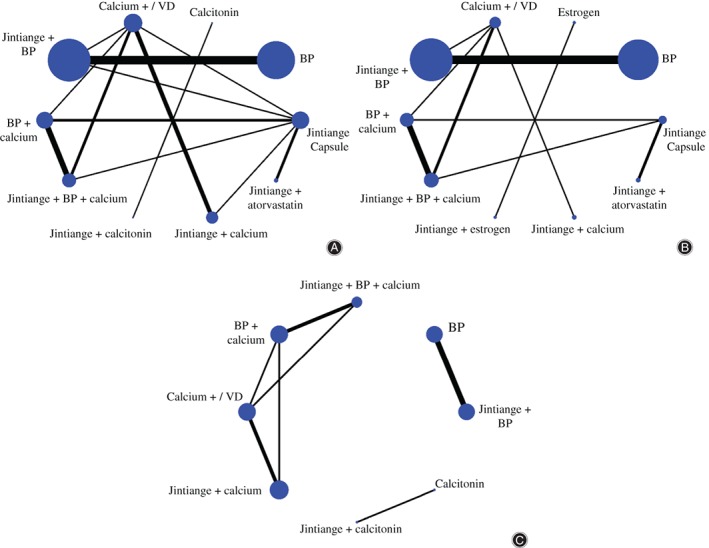
Figure 2.

Network diagrams depicting direct evidence used in network meta‐analysis. (A) Network diagram of lumbar bone mineral density (BMD) shows 13 direct comparisons and 32 indirect comparisons. (B) Network diagram of BMD of femoral neck shows 9 direct comparisons and 36 indirect comparisons. (C) Network diagram of the visual analog pain score (VAS) shows 7 direct comparisons and 21 indirect comparisons. Lines between two nodes mean there is direct evidence between two interventions; line thickness corresponds to the number of studies and the size of the nodes represents the total sample size of the treatments.
