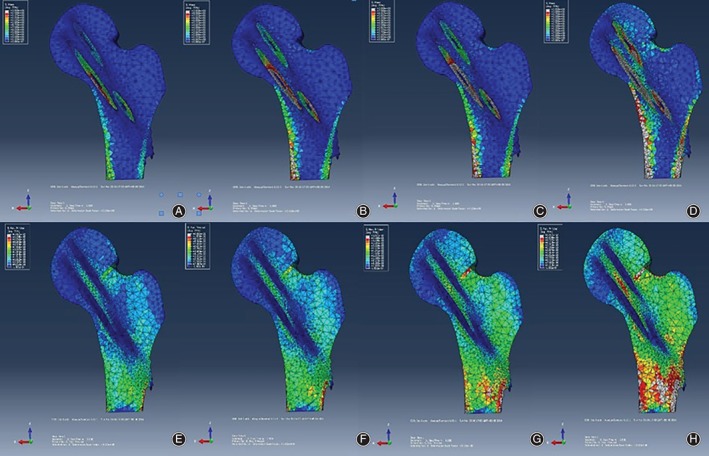
Figure 4.

Stress–strain distribution of a patient during gait: (A) indicates the stress distribution of the two‐legged standing period; (B) indicates the stress distribution of the one‐legged standing period; (C) indicates the stress distribution of the heel‐off period; (D) indicates the stress distribution of the toe‐off period; (E) indicates the strain distribution of the two‐legged standing period; (F) indicates the strain distribution of the one‐legged standing period; (G) indicates the strain distribution of the heel‐off period; and (H) indicates the strain distribution of the toe‐off period.
