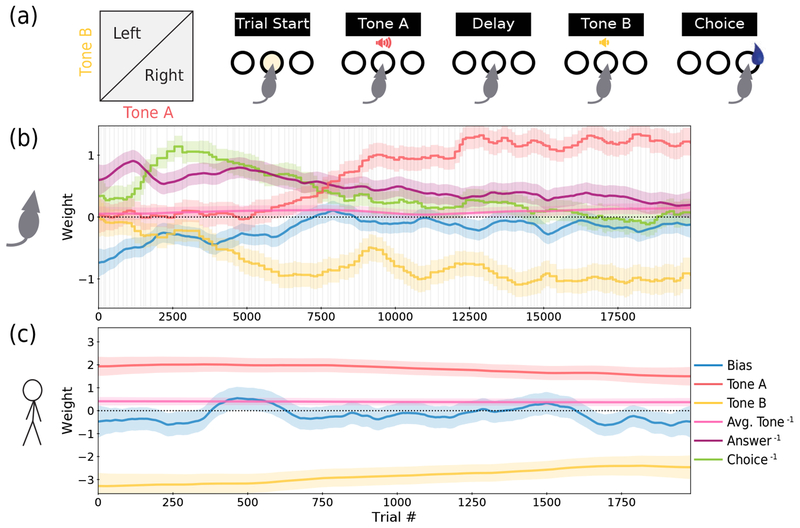
Figure 3:
Application to rat and human data. (a) For this data from [17], a 2AFC delayed response task was used in which the subject experiences an auditory stimulus (Tone A) of a particular amplitude, a delay period, a second auditory stimulus (Tone B) of a different amplitude, and finally the choice to go either left or right. If Tone A was louder than Tone B, then a rightward choice receives a reward, and vice-versa. (b) The psychometric weights recovered from the first 20,000 trials of a rat. Weights in the legend labeled with a “−1” superscript indicate that the weight carries information from the previous trial. The faded vertical gray lines indicate session boundaries. In addition to being fit with its own trial-to-trial volatility hyperparameter σk, each weight is also fit with an additional hyperparameter σk,day for volatility between sessions. This results in “steps” at the session boundaries for some weights (see Sec. 3.3). Each weight also has a 95% posterior credible interval, indicated by the shaded region of matching color (for derivation refer to Sec. S2). (c) The psychometric weights recovered from a human subject.

