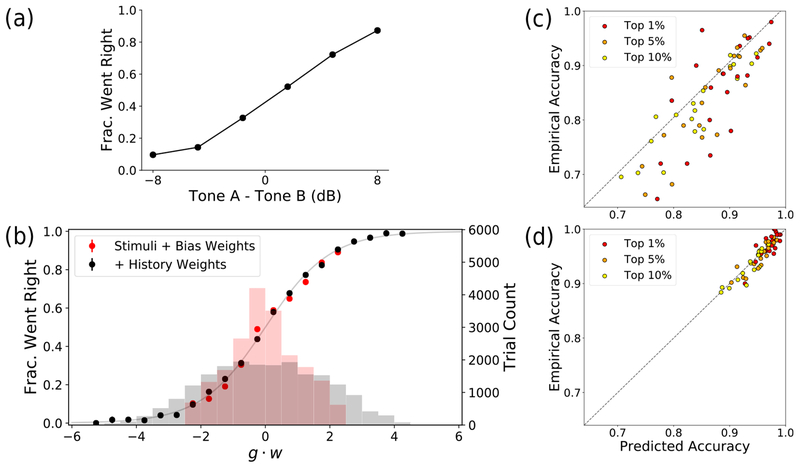
Figure 5:
Psychometric curve and model predictions. (a) A conventional psychometric curve for a rat, generated from a subset of trials at the end of training where Tone B is held constant. (b) The same rat during early training, with two models: the basic model with stimuli and bias weights only (red), and the history-aware model (black). The histograms (with right-side axis) show the number of trials within each g ∙ w bin. The dots (with left-side axis) plot the fraction of trials, within each bin, in which the rat went right (yt = 1). (c) For all 20 rats in the population, we plot the predicted accuracy vs. empirical accuracy for the top 1, 5, & 10% of most strongly predicted trials in the basic model (red). (d) Same as (c) but for the history-aware model (black).

