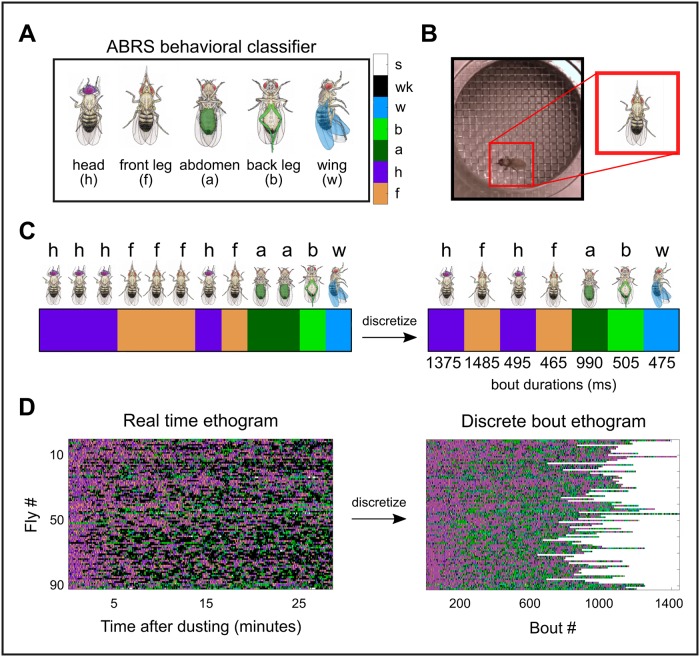
Fig 1. Applying the ABRS classifier to video data generates large-scale ethogram data sets.
A: The ABRS classifier is trained to annotate video data with labels corresponding to one of five grooming actions observed in D. melanogaster (front leg rubbing = f, head cleaning = h, abdomen cleaning = a, back leg rubbing = b, wing cleaning = w) or two non-grooming actions (walking = wk, standing = s, not shown). Color bar (right) displays the corresponding color code used for visualization of grooming action sequences. B: Flies are covered with dust, placed in a chamber, and recorded from above. Video data is then passed through the ABRS classifier, which locates the fly in each frame and applies a behavioral label. Here, the fly is shown performing a front leg rub. C: After classification, video data can be represented by a vector. Each vector element represents one frame and contains a behavioral label, visualized here using a color code. Without loss of information, the real time ethogram (left) is recast as a discrete bout ethogram, defined by discrete transitions between individual bouts, which are labeled by both action and duration. We refer to this process as “discretizing” the ethogram. This results in a vector (right) containing both an ordered list of grooming action labels (color) and grooming action durations (number). For example, the first bout shown here consisting of consecutive frames of head grooming would be discretized such that its corresponding action label would be “h”, indicated by the purple block. For illustrative purposes, we choose bout durations, shown below the discrete bout ethogram, that are representative of the observed distributions. We refer to instances of sustained identical grooming actions as bouts. D: Real time ethograms for 92 dusted flies (left) are shown as a matrix containing 92 rows and 50,000 columns. After discretization, ethograms contain variable numbers of bouts but retain information about bout order and bout duration (right).

