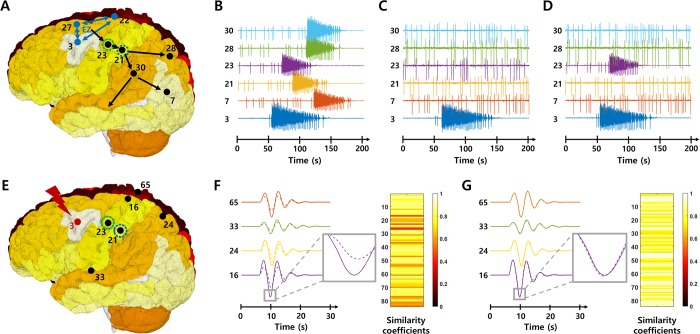
Fig 1. Brain network simulations using TVB.
A-D Network simulations for the effectiveness evaluation. The brain network model assesses the effectiveness by identifying the seizure propagation characteristics. Figures show simulated signals at each brain node B before and C-D after removal of the node 23 or node 21 respectively, when nodes 3, 22 and 27 act as EZ. E-G network simulations for the safety evaluation. The brain network model assesses the safety by investigating the integrity of the transient spatiotemporal trajectory following electrical stimulation at certain nodes. When a stimulus is applied to the node 3, the stimulation induces different response signals at each node (solid lines, F-G). When removing all connections from the node 23, the response signals (dotted lines, F) at each node are altered compared to before removal. On the other hand, when eliminating the node 21, the response signals (dotted lines, G) are not significantly different from that before removal. The color bars represent similarity coefficients between the response signals at each node before and after elimination.

