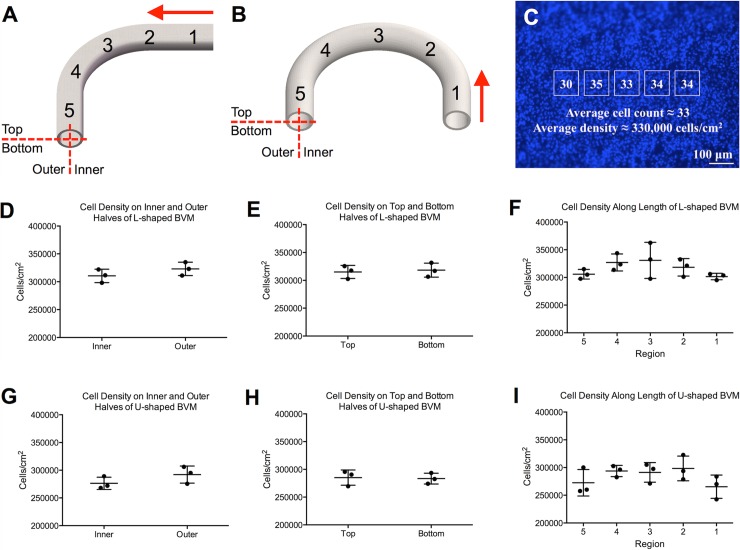
Fig 5. Cells deposited evenly throughout the luminal surface of L- and U-shaped scaffolds.
To quantify the number of cells that deposited onto L- and U-shaped scaffolds, cells were counted in various regions throughout the luminal surface of the scaffolds after one day of cultivation. (A–B) Specifically, cells were counted on the inner and outer halves of the scaffolds, on the top and bottom halves of the scaffolds, and in five regions along the length of the scaffolds (red arrows denote the direction of fluid flow). Cell counting was performed on fluorescent BBI images. (C) Specifically, a template of five boxes was overlaid onto the BBI images, and cells in the boxes were counted and averaged to obtain a number of cells per unit area for each image. (D–F) In L-shaped BVMs, there was no statistically significant difference between the cell densities on the inner and outer halves (p = 0.272, n = 3), on the top and bottom halves (p = 0.765, n = 3), or along the length (p = 0.279, n = 3). (G–I) In U-shaped BVMs, there was no statistically significant difference between the cell densities on the inner and outer halves (p = 0.223, n = 3), on the top and bottom halves (p = 0.860, n = 3), or along the length (p = 0.244, n = 3).

