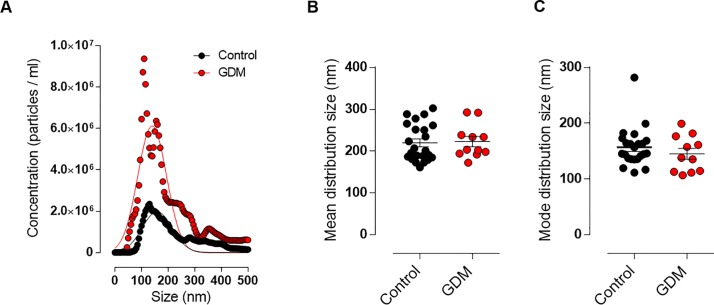
Fig 2. Nanoparticle tracking analysis of EVs isolated from GFC using ExoQuick in controls and patients with GDM.
A. Distribution size of EVs isolated from GCF with higher concentration of nanoparticles in the GDM group (red dots) in comparison with the control group (black dots). B. Mean and C. Mode distribution size of total extracellular vesicles isolated from Controls (n = 23) and GDM (n = 11) pregnant women. GDM, gestational diabetes mellitus.

