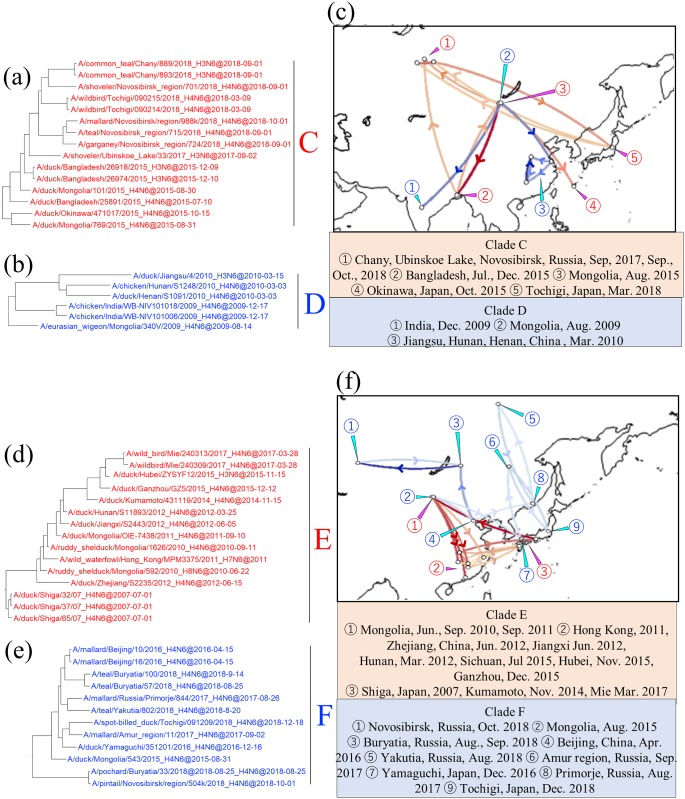
Fig 4. Detail of maximum clade credibility (MCC) phylogenetic trees of N6 NA genes in clades C, D, E, and F and visualized location-annotated MCC trees for selected clades on the world map.
Clades C and D are red type and blue type, respectively in each tree (a and b), and colored type lines in (c) correspond to those of the clades. Clades E and F are red type and blue type, respectively, in each tree (d and e), and colored type lines in (f) correspond to those of the clades. Lines with Bayes factors of 3.0 or more are shown in the map, and a deeper color means a higher Bayes factor.

