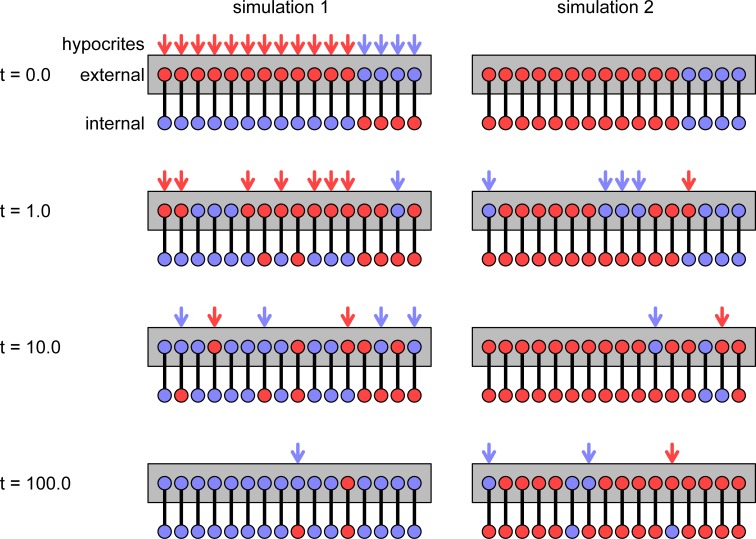
Fig 2. Two illustrative simulations in a relatively small group (N = 16 individuals).
Each panel shows the state of the group at a given time from t = 0.0 to 100.0. (We write time with a decimal point because it is a continuous variable in our model.) The update rates are c = 1,e = 1/4, and i = 1/16. In each snapshot, the upper/lower nodes show the external/internal opinions (red or blue). In the external layer, the nodes are linked in a complete graph. We do not show the links, only indicate full connectedness by a gray box. (The reflexive self-link is also included. Therefore, every individual is linked with N = 16 individuals within the external layer.) The link between each individual’s external and internal opinion is represented by a vertical line. Arrows mark those individuals who are hypocrites. The color of the arrow shows the external opinion. Initially, both groups contain 12 red and 4 blue opinions in the external layer. The difference is in the occurrence of hypocrisy: in the left/right column, every individual is initially hypocritical/frank. By t = 100.0, one of the opinions has reached a significant majority in each simulation (i.e., the group is close to a consensus).

