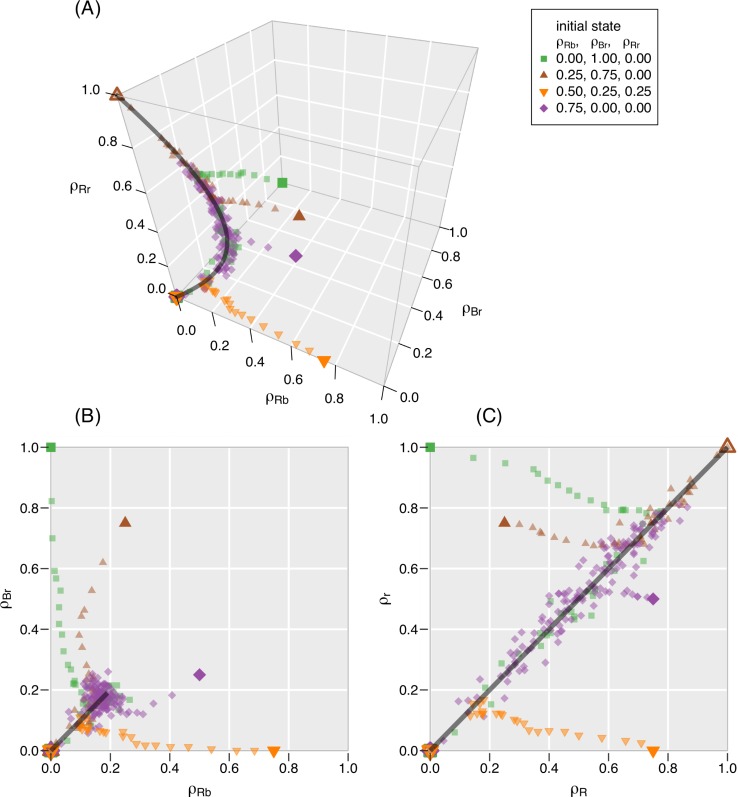
Fig 3. Changes in the composition of the group over time in four realizations of the CVM.
Each point belongs to one “snapshot” between the initial state (large, filled symbols) and the consensus (large, open symbols). The parameters for all simulations are N = 400, c = 1, e = 1/4, i = 1/16. We show only a single simulation for each initial condition, but we note that repeated simulations from the same initial state can end in either of the absorbing states unless the initial state is already a consensus. The time intervals between the plotted points change along the trajectories: during the transient, we plot every 100th time step until the 2000th time step. Afterwards we plot only every 10000th time step because the spatial density of data points is higher along the attractor. (A) Abundances of the two kinds of hypocrites (ρRb and ρBr) and the proportion of frank red individuals (ρRr). These variables completely describe the state of the system. The theoretical attractor (Eq 5) is shown as a black curve. (B) Equalization of the two kinds of hypocrites in the same realizations. In a consensus, there are no hypocrites (i.e., ρRb = ρBr = 0). Therefore, the open symbols at the consensus overlap. The attractor appears as a straight line because it is a two-dimensional projection of the curve embedded in three dimensions. The line is exactly on the diagonal. (C) Equalization of the abundance of the red opinion in the external (ρR = ρRb+ρRr) and internal layer (ρr = ρBr+ρRr). The attractor (black line) is exactly on the diagonal.

