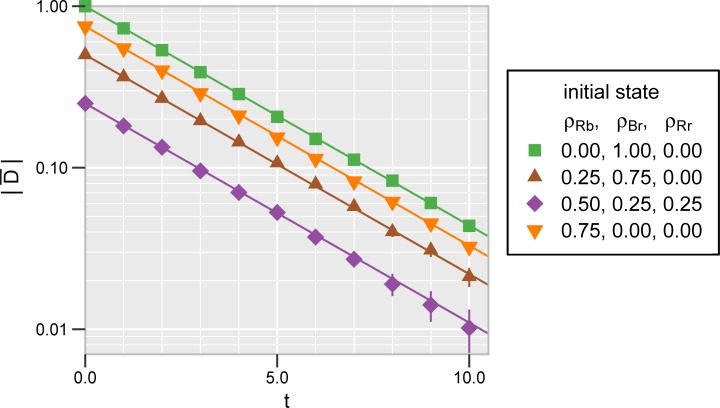
Fig 4. Equalization of the two kinds of hypocrites over time.
The parameter values are the same as in Fig 3. The initial conditions are also the same for the corresponding shapes and colors. The vertical axis shows the absolute value of the mean difference on a logarithmic scale. The mean was obtained from 1000 independent realizations. The error bars are shown only where they are larger than the symbol sizes. The solid lines are theoretical predictions under the assumption that decays exponentially with rate e+i (Eq 6).

