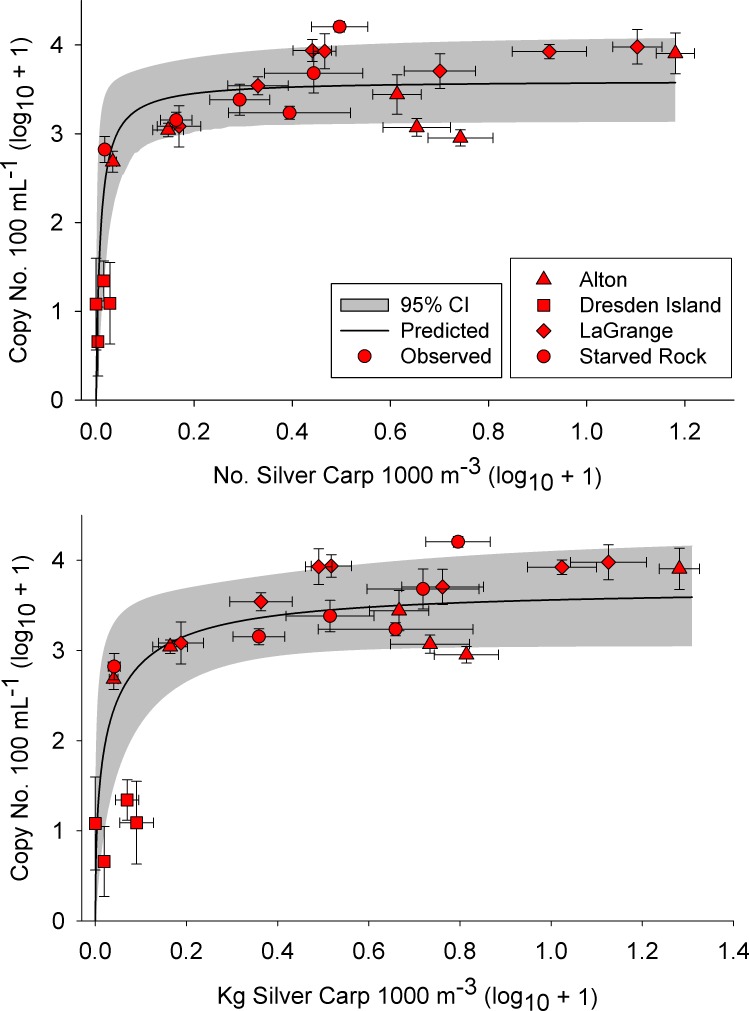
Fig 3. Relationships between site mean (standard error; SE) Silver Carp density and mean (SE) eDNA concentration (SC-TM4 marker) collected from the Illinois River, USA.
Symbols represent river reach (see Fig 1) and error bars reflect variability among samples at a site.

