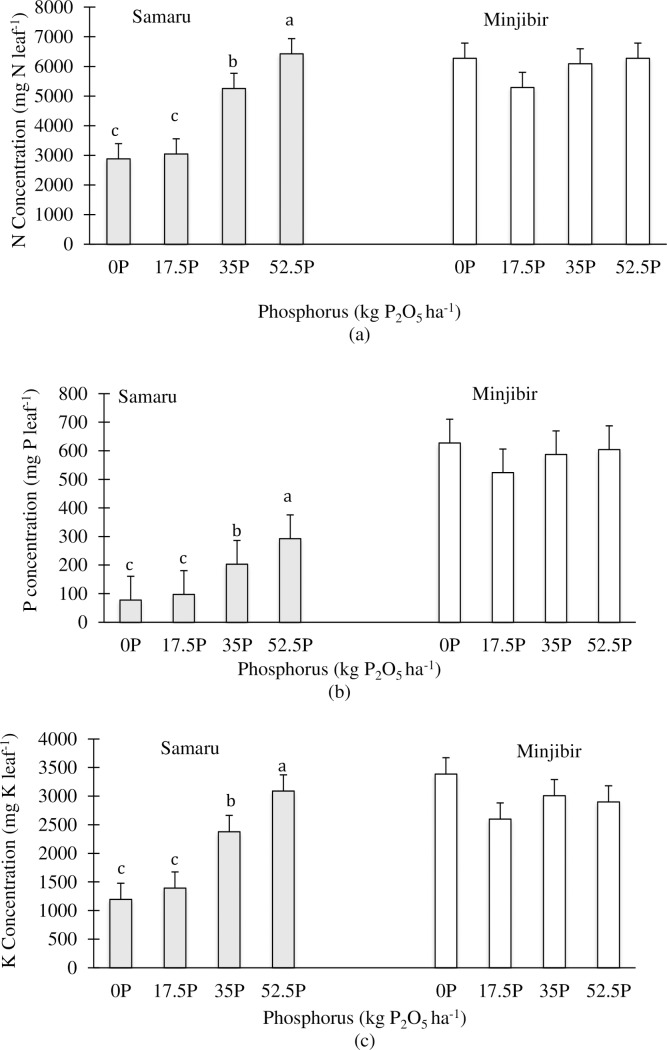
Fig 4. Main P treatment effects on leaf macronutrient concentrations in cassava.
(a) Mean leaf N concentration (b) Mean leaf P concentration and (c) Mean leaf K concentration at both trial sites (Samaru and Minjibir) averaged over all the inoculation levels for the four different P fertilizer levels.

