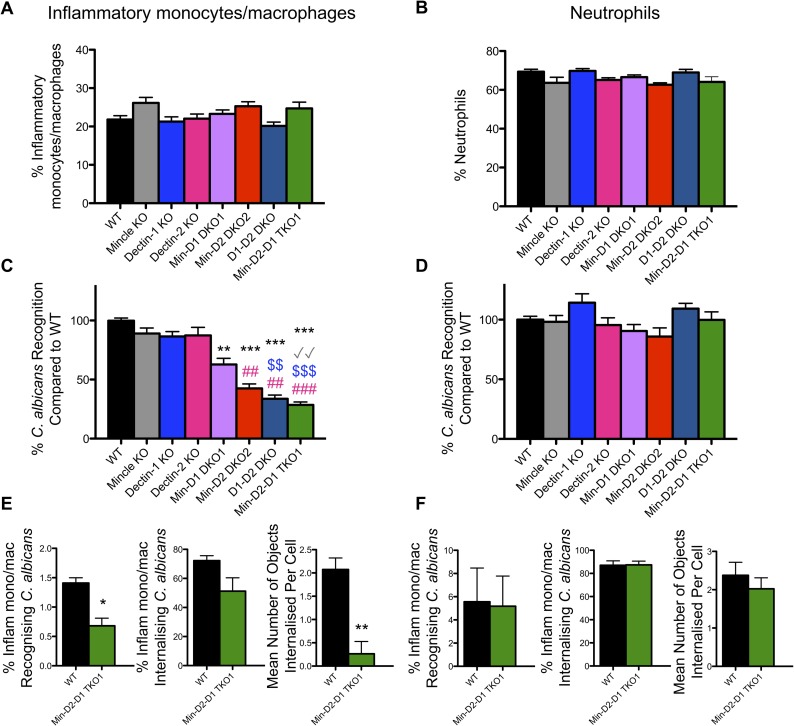
Fig 3. CLR collaboration mediates C. albicans recognition by inflammatory monocytes/macrophages but not neutrophils.
(A-F) WT and CLR KO mice were injected with BIOgel i.p. and inflammatory cells were recovered by peritoneal lavage after 16–18 h. (A-D) Cells were stimulated for 15 min at 37°C with cell trace far red-labelled C. albicans at a 1:1 ratio. Cells were stained with anti-Ly6G and anti-CD11b. (A-B) Graphs display % recruited Ly6G-CD11b+ inflammatory monocytes/macrophages (A) and % Ly6G+CD11b+ neutrophils (B) in the peritoneal cavity 16–18 h after BIOgel injection. (1-way ANOVA with Bonferroni’s post-test: Performed on transformed data for Inflammatory monocytes/macrophages) (C) Ly6G-CD11b+ inflammatory monocytes/macrophages and (D) Ly6G+CD11b+ neutrophils that interacted with C. albicans were measured by flow cytometry. Percentage WT cells that recognised C. albicans was set at 100%. n = 7–16 mice. Graphs show cumulative data from 8 independent experiments. (Inflammatory monocytes/macrophages: Kruskal-Wallis test with Dunn’s post-test; Neutrophils: 1-way ANOVA with Bonferroni’s post-test). * compared to WT, √ compared to Mincle KO, $ compared to Dectin-1 KO, # compared to Dectin-2 KO (E-F) WT and Min-D2-D1 TKO1 cells were stained with anti-Ly6G and anti-CD11b. Cells were stimulated with cell trace far red-labelled C. albicans at a 1:1 ratio for 1.5 h and analysed by image flow cytometry (Amnis Imagestreamx MkII) for the course of the 1.5 h stimulation at room temperature. Inflammatory monocytes/macrophages (E) and neutrophils (F) that interacted with labelled C. albicans, internalised C. albicans and the mean number of objects internalised per cell that recognised C. albicans were quantified. n = 3 mice. (Student’s paired t test: % Inflam mono/mac recognising C. albicans on normalised data). (E-F) Graphs show the cumulative results from 3 independent experiments.

