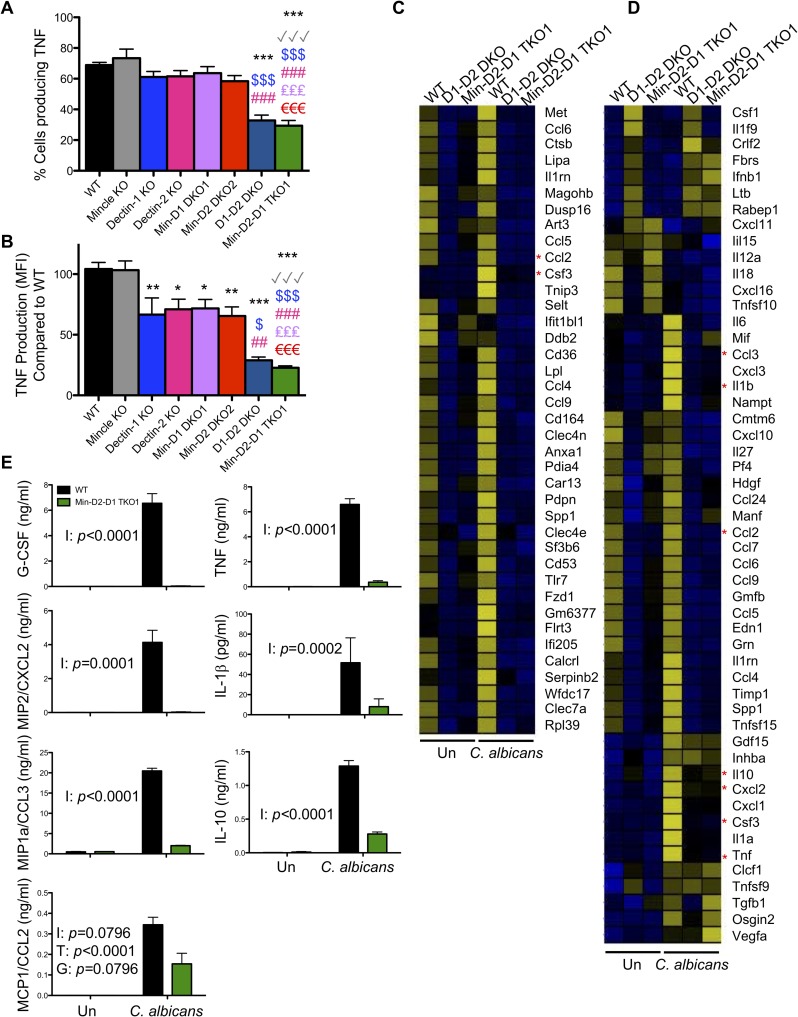
Fig 5. CLR collaboration mediates C. albicans-induced cytokine/chemokine production from inflammatory monocytes/macrophages.
(A-D) WT and CLR KO mice were injected with BIOgel i.p. and inflammatory cells were recovered by peritoneal lavage after 16–18 h. (A-B) Cells were stimulated for 3 h with cell trace far red-labelled C. albicans at a 1:1 ratio in the presence of Brefeldin A. TNF levels were analysed by flow cytometry. Percentage Ly6G-CD11b+ inflammatory monocytes/macrophages that produced TNF—isotype (A) and MFI TNF production—isotype (B) was measured by flow cytometry in inflammatory monocytes/macrophages that interacted with labelled C. albicans. TNF MFI for WT cells interacting with C. albicans was set at 100%. (A-B) n = 2–7 mice. Graphs show cumulative data from 5 independent experiments. (1-way ANOVA with Bonferroni’s post-test). (C-D) Ly6Chi inflammatory monocytes were purified by cell sorting. Cells were stimulated with C. albicans at a ratio of 3:1 (Cells:Candida) for 3 h. RNA was extracted and RNAseq analysis was performed. Data shows the mean from two replicates each of WT and Min-D2-D1 and one replicate of D1D2 DKO cells. 177 protein coding transcripts that showed 10 or more reads and an adjusted p value of <0.05 (Benjamin-Hochberg correction for multiple testing) were selected from the RNAseq data. Following Z transformation across genes, genes were clustered by K means of FPKM values into 3 clusters using Genesis software (S8 Fig). (C) Genes from Cluster 1 are displayed. (D) Heatmap displays genes with the GO terms chemokine activity (GO:0008009), cytokine activity (GO:0005125) and growth factor activity (GO:0008083) for transcripts that showed 10 or more reads. (C-D) Data range -2.5 (blue) to +2.5 (yellow). Asterisks highlight the genes chosen for validation. (E) Bone marrow monocytes were bead purified from WT and Min-D2-D1 TKO1 mice and stimulated with C. albicans at a ratio of 1:1 for 24 h in the presence of Amphotericin B. Cytokines and chemokines in the supernatants were measured by ELISA. Graphs display cumulative data from 4 independent experiments. I = Interaction, T = Treatment, G = Genotype (matched 2-way ANOVA on transformed data).

